2024 State Shared Revenue Estimator
This tool helps cities, towns, and counties in Washington State estimate the per capita shared revenues they can expect to receive from the state government, including liquor, criminal justice, gas tax, and multimodal distributions.
It is part of MRSC's series on Budgeting in Washington State.
We update this page every year in late July. The estimates shown below are to help cities and counties develop their shared revenue estimates for the 2024 budget (adopted in calendar year 2023).
Overview
The State of Washington shares revenues from several sources with counties, cities, and towns across the state. Some of these revenues are distributed on a per capita (population) basis, while others are distributed according to other formulas.
In our effort to assist local governments develop their budget forecasts, we provide estimates of the per capita revenues that the state is expected to distribute to cities and counties. This tool provides an easy way for your jurisdiction to see the expected amount of per capita shared revenues it will receive in the upcoming budget year.
Historical distribution amounts back to 2013 can be found on the Washington State Fiscal Distributions to Local Entities database, but note that these are shown by state fiscal year (July 1-June 30) rather than the city/county fiscal year (January 1-December 31).
Important Notes - Read First
Before using this tool, please read the following information:
This tool only estimates per capita (population-based) shared revenues. It does not estimate other shared revenues that are distributed according to other statistical factors that are not directly population-based, such as county transportation distributions or certain criminal justice revenues. For a full discussion of state shared revenues, see our annual Budget Suggestions publication.
These figures are point-in-time estimates only. These projections reflect our best information for the upcoming calendar year and are updated at the end of July each year when we publish Budget Suggestions. This information is based on the current state budget, the most recent population numbers, state revenue forecasts, and other factors. They are not official distribution numbers.
Some of these distributions are relatively stable and are not likely to change much unless there is new legislation. However, other distributions may fluctuate. In particular, gas tax (MVFT) revenues depend on actual gallons sold at the pump which can be impacted by severe weather (such as major snowstorms) as well as other economic disruptions, while cannabis and liquor excise distributions depend on actual retail sales. To mitigate these fluctuations, consider reviewing the state's quarterly Transportation Revenue Forecast (for MVFT distributions to cities and counties) and Quarterly Economic and Revenue Forecasts (for a glimpse at overall liquor and cannabis revenues).
We do not provide cannabis excise tax distribution estimates. The formula depends not only on population, but also on cannabis (marijuana) retail sales as well as the number/total population of cities and counties that prohibit cannabis. Funds may only be distributed to jurisdictions that do not prohibit the siting of any state licensed cannabis producer, processor, or retailer (RCW 69.50.540).
Other miscellaneous notes:
- All cities and towns receive a minimum distribution of $1,000 for "Criminal Justice - Population" regardless of size, which is factored into our calculations (RCW 82.14.330(1)(a)(ii)).
- County liquor distributions are calculated based on unincorporated population only, so for counties the population number shown below reflects the unincorporated population only.
- For city and county population figures, we use the most recent April 1 OFM population projections. OFM also makes quarterly adjustments for any new annexations, but the overall impact on per capita distributions for other jurisdictions should be minimal.
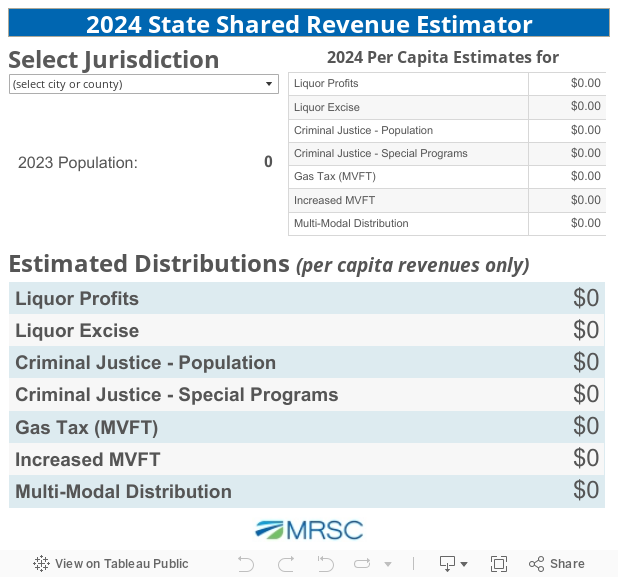
Estimate Your Shared Revenue Distributions
After reading the "Important Notes" section above, simply select the name of your city or county from the drop-down menu below to view your jurisdiction's estimated per capita distributions. To save or print this information, click "Download" in the bottom right corner and select "PDF."
If you have questions, concerns, or feedback about these estimates, please contact us.